
BMI Calculator — Free, Accurate & Personalized for Men and Women
Calculate your Body Mass Index (BMI) instantly in kg or lbs. See your BMI scale result, understand what it means for your age and sex, and get a personalized walking plan and action steps — no signup needed.
Advertisement
Calqulate.net calculates your Body Mass Index from height and weight, cross-checked with waist data and a muscle-vs-fat caveat for fairness. You get an honest result and the exact amount to gain or lose.
WHO
Standard
2
Unit systems
Free
Price
No
Sign-up
Instant
Results
What Is BMI? The Body Mass Index Explained Simply
BMI — or Body Mass Index — is a number calculated from your height and weight. It was developed in the 1830s by Belgian mathematician Adolphe Quetelet and later adopted by the WHO as a population-level screening tool. Today, the CDC adult BMI calculator and NHLBI both use the same formula to classify adults into four weight categories.
Here's the honest truth most websites skip: BMI is a starting point, not a verdict. In 2023, the American Medical Association (AMA) updated its official policy to clarify that BMI should not be used as a sole diagnostic measure — especially considering differences across gender, age, and ethnicity, including documented differences in African American BMI chart interpretation versus Asian populations. What BMI does well is give you a fast, free, and reasonably reliable signal about your weight category so you can take the right next step.
Metric Formula (kg/cm):
BMI = Weight (kg) ÷ Height² (m)
Imperial Formula (lbs/inches):
BMI = [Weight (lbs) ÷ Height² (in)] × 703
The 703 factor converts pounds/inches to the metric equivalent. This is why the CDC BMI calculator and NHLBI BMI calculator produce identical results to our tool.
Example — Calculate my BMI in kg:
Weight: 70 kg · Height: 1.70 m
Math: 70 ÷ (1.70²) = 70 ÷ 2.89
BMI = 24.2 → Normal Weight
Example — 5'4" female, 155 lbs:
Math: [155 ÷ (64²)] × 703
BMI = 26.6 → Overweight
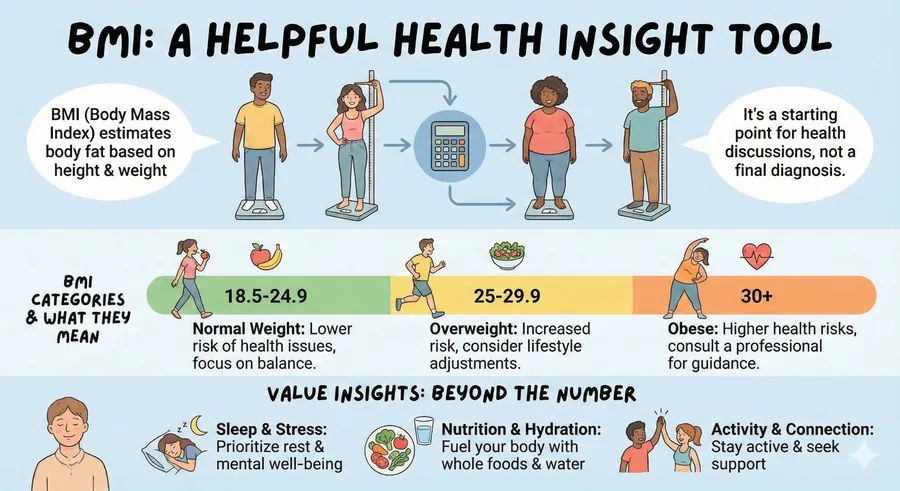
BMI Chart for Men and Women — What Your Number Actually Means
The BMI scale ranges from underweight to severe obesity. Here's what each category means in real life — not just clinical terms — plus the health risks the CDC and NIH associate with each range.
| BMI Range | Category | What It Feels Like | Health Risk |
|---|---|---|---|
| Below 18.5 | Underweight | Fatigue, frequent illness, poor stamina, difficulty gaining muscle | Moderate — nutritional deficiencies, bone loss |
| 18.5 – 24.9 | Normal Weight | Good energy, lower doctor visits, clothes fit consistently, easier physical activity | Low — maintain with consistent habits |
| 25.0 – 29.9 | Overweight | Sluggish after meals, slight joint discomfort, clothes getting tighter, tired faster during cardio | Increased — high blood pressure, prediabetes |
| 30.0 – 34.9 | Obese (Class I) | Breathlessness on stairs, joint pain, sleep disturbances, lower energy throughout day | High — type 2 diabetes, sleep apnea, heart disease |
| 35.0 – 39.9 | Obese (Class II) | Significant physical limitations, chronic fatigue, higher medication dependence | Very High — medical intervention often needed |
| 40+ | Obese (Class III) | Severe mobility issues, multiple comorbidities, highest cardiovascular burden | Extreme — consult bariatric specialist |
Source: CDC Adult BMI Categories · WHO Global Database on Body Mass Index · NHLBI Clinical Guidelines
BMI Chart by Height — Quick Reference for Common US Heights
One of the most searched questions on this topic is "what does my BMI mean at my exact height?" Here are the healthy weight ranges, overweight thresholds, and obesity cutoffs for the most common US heights — for both women and men. These numbers match the NHLBI BMI table exactly.
| Height | Healthy (BMI 18.5–24.9) | Overweight (BMI 25–29.9) | Obese (BMI 30+) |
|---|---|---|---|
| 5'0" (152 cm) | 97–127 lbs | 128–152 lbs | 153+ lbs |
| 5'2" (157 cm) | 104–135 lbs | 136–163 lbs | 164+ lbs |
| 5'3" (160 cm) | 107–140 lbs | 141–168 lbs | 169+ lbs |
| 5'4" (163 cm) | 110–144 lbs | 145–173 lbs | 174+ lbs |
| 5'5" (165 cm) | 114–149 lbs | 150–179 lbs | 180+ lbs |
| 5'6" (168 cm) | 118–154 lbs | 155–185 lbs | 186+ lbs |
| 5'7" (170 cm) | 121–158 lbs | 159–190 lbs | 191+ lbs |
| 5'9" (175 cm) | 128–168 lbs | 169–202 lbs | 203+ lbs |
| 6'0" (183 cm) | 140–183 lbs | 184–220 lbs | 221+ lbs |
| 6'1" (185 cm) | 144–188 lbs | 189–226 lbs | 227+ lbs |
| 6'5" (196 cm) | 160–209 lbs | 210–251 lbs | 252+ lbs |
Calculated using standard WHO BMI formula. Values apply to adults 20+. Source: NHLBI.
Common specific BMI questions — answered:
5'2" female, 170 lbs: BMI ≈ 31.1 → Obese Class I
5'7" male, 180 lbs: BMI ≈ 28.2 → Overweight
5'4" female, 130 lbs: BMI ≈ 22.3 → Normal Weight ✓
5'3" female, 155 lbs: BMI ≈ 27.4 → Overweight
6'1" male, 220 lbs: BMI ≈ 29.0 → Overweight
5'5" female, 180 lbs: BMI ≈ 30.0 → Obese Class I
BMI Calculator for Women — What No One Tells You
Women checking their BMI face a unique challenge: the standard BMI chart was built primarily on male population data. While the categories apply equally, what those numbers mean in your body is different.
Women naturally carry 6–11% more body fat than men at the same BMI — this is biological and normal, driven by estrogen, reproductive function, and fat distribution patterns. This means a woman with a BMI of 24 may have a higher body fat percentage than a man with the same BMI, yet still be in excellent metabolic health.
Healthy BMI for Women by Age
| Age Group | Healthy BMI Range |
|---|---|
| 20–29 | 18.5 – 23.5 |
| 30–39 | 18.5 – 24.9 |
| 40–49 | 19.0 – 25.5 |
| 50–59 | 19.5 – 26.5 |
| 60+ | 20.0 – 27.0 |
Note: These are evidence-informed ranges, not official CDC thresholds. Consult your doctor for individual guidance.
BMI for Women — Situations Where It's Misleading:
PCOS & Thyroid Conditions
Both conditions directly alter fat storage and weight. Women with PCOS may have a higher BMI at the same calorie intake as unaffected women. Your BMI number is not a reflection of effort or willpower.
Hormonal Weight Fluctuations
Your weight can vary 2–5 lbs across your menstrual cycle due to water retention. A BMI test taken during your period may read 0.5–1 point higher — this is temporary and normal.
Post-Pregnancy Weight
It takes the average woman 6–18 months to return to pre-pregnancy weight. BMI during this period should be interpreted with extra context, not urgency.
Menopause & After 50
Estrogen decline shifts fat from hips to abdomen. Even with a normal BMI, waist circumference above 35 inches signals elevated metabolic risk post-menopause.
Obesity Scale for Women — Understanding BMI 30–45+
30–34.9
BMI 33–35 female
Class I — Actionable with lifestyle change
35–39.9
BMI 35–36 female
Class II — Medical guidance recommended
40–44.9
BMI 40–44 female
Class III — Consult bariatric specialist
45+
BMI 45 female
Class III Severe — Urgent medical support
BMI Calculator for Men — The Muscle Problem
If you lift weights, play sports, or have a physically active job, your BMI calculator result may show "overweight" or even "obese" — while your actual body fat is perfectly healthy. This is BMI's most well-known limitation for men.
Here's a real example: a 5'11" man who weighs 195 lbs has a BMI of 27.2 — technically overweight by the BMI scale. But if his waist is 32 inches and he can run a 10-minute mile, he's in better cardiovascular health than someone with a BMI of 23 who sits all day. For men, BMI is most accurate when combined with waist circumference.
Healthy BMI for Men by Age
| Age | Target BMI | Waist Target |
|---|---|---|
| 20–29 | 20.0–24.9 | Under 32 in |
| 30–39 | 21.0–25.9 | Under 34 in |
| 40–49 | 22.0–26.5 | Under 36 in |
| 50–59 | 22.5–27.0 | Under 38 in |
| 60+ | 23.0–28.0 | Under 40 in |
For Men Who Train: BMI vs Reality
The BMI calculator for bodybuilding context is especially unreliable. If you strength train regularly, use these secondary checks alongside BMI:
Walking Plan According to Your BMI — The Best Starting Point
Walking is the most underrated fat-loss tool. Research published in the Journal of the American Medical Association (JAMA) found that walking 7,000–9,000 steps daily reduces all-cause mortality by 50–70%. It doesn't spike cortisol, doesn't require equipment, and works at any BMI level. Here's a personalized walking plan based on your BMI result:
BMI 18.5–24.9 (Normal)
Maintenance: 7,000–10,000 steps/day. Add 2 strength sessions/week to maintain lean mass. Walk after dinner — it lowers blood sugar spikes by up to 30%.
BMI 25–29.9 (Overweight)
Week 1–2: 5,000 steps/day. Week 3–4: 7,000 steps. Week 5+: 10,000 steps. Brisk pace (3–4 mph). This pace burns 200–300 calories/hour and lowers blood pressure measurably within 8 weeks.
BMI 30–35 (Obese Class I)
Start with 15-min walks twice daily. Build to 30 min continuous by week 4. Flat terrain first — reduce joint impact. Target: 6,000–8,000 steps/day by week 6. Small increments = sustainable results.
BMI 35+ (Obese Class II–III)
Consult your doctor before starting. Water walking or pool walking removes 90% of joint impact. Start with 10 min/day and add 2 min per week. Walking 45–60 min daily at this level can produce 1–2 lb/week loss.
BMI Calculator by Age — How Your Number Changes Over Time
The BMI formula itself doesn't change with age — but what your BMI means does. As you get older, your muscle mass naturally declines (a process called sarcopenia), your metabolism slows, and fat redistributes toward the abdomen. Two people can have identical BMIs at age 25 and 55 but wildly different health profiles.
Your 20s
BMI is most straightforward
Metabolism is high, muscle mass is naturally elevated. A BMI of 22–24 is genuinely ideal. Watch for the 'freshman 15' or post-college weight gain as activity levels drop.
Your 30s–40s
BMI can creep up silently
Muscle loss begins around age 30 at ~0.5–1% per year. Weight on the scale may stay constant, but body composition shifts toward more fat. Resistance training becomes critical to keep BMI meaningful.
50s and Beyond
Context matters most
Post-menopausal women and older men often have a 'healthy' BMI but elevated visceral fat. Some research suggests a BMI of 25–27 in adults over 65 is associated with better outcomes than a BMI under 22.
When BMI Is Misleading — And What to Use Instead
The AMA, in its 2023 policy update, explicitly stated that BMI alone should not be used to make clinical decisions. This isn't a reason to dismiss BMI — it's a reason to use it correctly. BMI is a screening tool, like a warning light on your dashboard. It tells you to look further. It doesn't tell you exactly what's wrong.
BMI is least accurate for these groups:
Athletes & bodybuilders
High muscle mass inflates BMI
Pregnant women
Weight gain is normal and healthy
Adults over 65
Muscle loss makes BMI overestimate fat
Children & teens
Use CDC BMI-for-age percentiles instead
Very tall or short people
Traditional formula distorts at extremes
Different ethnicities
Asian populations have higher health risk at lower BMIs
Better Than BMI Alone — A Complete Picture:
Waist-to-Height Ratio: Waist (inches) ÷ Height (inches). Under 0.5 = low risk. Simple and fast.
Body Fat %: Measured by DEXA scan, hydrostatic weighing, or skinfold calipers. Gold standard.
Waist Circumference: Under 35 in (women), under 40 in (men) = low metabolic risk.
Ponderal Index: Weight ÷ Height³. Better for very tall or short individuals (shown in our results).
Practical Diet Changes to Improve Your BMI
You don't need a meal plan overhaul. Research consistently shows that small, consistent substitutions outperform drastic diet changes for long-term BMI improvement. Here are realistic swaps for both US and Indian eating patterns:
🇺🇸 For US Eating Patterns
| Instead of | Switch to |
|---|---|
| 16 oz soda (200 cal) | Sparkling water + lemon (0 cal) |
| Fast food lunch daily | Meal-prepped protein bowl 4x/week |
| Chips as snack | Apple + 2 tbsp peanut butter |
| White bread sandwich | Whole grain or lettuce wrap |
| Ranch dressing | Olive oil + vinegar (50% less fat) |
| Dinner plate = full | Half plate vegetables, always |
🇮🇳 For Indian Eating Patterns
| Instead of | Switch to |
|---|---|
| Fried namkeen as evening snack | Roasted chana or makhana |
| 3–4 cups sugary chai | 1–2 cups with half sugar |
| White rice daily | Mix brown rice or millets |
| Deep-fried puri/bhatura | Whole wheat roti (baked) |
| Maida-based sweets daily | 1–2 pieces maximum, post-lunch |
| Packaged biscuits | Banana or handful of dates |
Each swap saves 150–300 calories. At 200 calories saved per day, that's ~1.7 lbs of fat lost per month — without a single gym visit.
Realistic Timeline: How Long Does It Take to Lower BMI?
This is the question everyone really wants answered. Here's the honest, research-based timeline — no false promises:
BMI Drop
0.5–1 Point
3–4 Weeks
Cutting 500 cal/day from diet only
BMI Drop
1–2 Points
6–8 Weeks
Diet + 30-min daily walking
BMI Drop
3–5 Points
3–5 Months
Consistent deficit + exercise combo
BMI Drop
5+ Points
6–12 Months
Structured program with medical guidance
What to Do Right Now — Based on Your BMI Result
Pick your category and follow the next steps. Bookmark this page — you'll want to come back and track your progress.
- ✓Calculate your TDEE → eat 300–500 calories above it
- ✓Prioritize protein: eggs, lentils, Greek yogurt, paneer, chicken
- ✓Start light resistance training 3x/week — muscle > fat for weight gain
- ✓Rule out underlying causes: thyroid, GI issues, eating disorders
- ✓Sleep 8–9 hours — growth hormone peaks during deep sleep
- ✓Don't ignore it — 'normal BMI' doesn't mean no risks
- ✓Check your waist circumference every 3 months
- ✓Aim for 150 min moderate exercise per week (CDC guideline)
- ✓Recheck your BMI every 2–3 months — use our save feature
- ✓Your best tool now is consistency, not change
- ✓Calculate your calorie deficit: 500 cal/day = ~1 lb/week loss
- ✓Start with 30-min brisk walks daily — no gym needed
- ✓Cut one ultra-processed food per week, not everything at once
- ✓Track sleep — under 6 hrs raises hunger hormone (ghrelin) by 24%
- ✓Use our TDEE calculator to find your exact maintenance calories
- ✓Talk to your doctor before intense exercise — protect your joints
- ✓Start with 10-min walks twice daily, then build from there
- ✓Focus on reducing processed sugar and liquid calories first
- ✓Know this: people who start at BMI 35+ see the fastest early results
- ✓GLP-1 medications (Ozempic, etc.) are now FDA-approved for BMI 30+ with risk factors
Your BMI is a signal — not a sentence.
The number you just calculated took 2 seconds to produce. Changing it takes weeks and months of consistent small decisions — not one dramatic overhaul. The people who succeed are not those with the most willpower. They're the ones who made the habits boring and automatic.
Save your result above. Come back in 6–8 weeks. Recalculate. The delta between those two numbers — that's your real progress indicator, not what you see in the mirror day-to-day.
Sources & References
CDC: Adult BMI Categories — cdc.gov/bmi
NHLBI / NIH: Calculate Your BMI — nhlbi.nih.gov/calculate-your-bmi
WHO: Global Database on Body Mass Index — who.int
AMA: AMA Policy on BMI as a Measure in Medicine (2023) — ama-assn.org
PMC / NIH: BMI Interpretation across Age Groups — pmc.ncbi.nlm.nih.gov/articles/PMC9396052
JAMA: Steps/Day and Mortality — jamanetwork.com (2021)
Trefethen, Oxford: New BMI Formula Proposal — people.maths.ox.ac.uk
MedicalNewsToday: Healthy Weight by Height — medicalnewstoday.com
BMI cannot tell fat from muscle
Your BMI comes from two numbers, height and weight, so it cannot see what the weight is made of. Two people at the same BMI can be in completely different shape. Calqulate Vitals logs your weight, waist and body composition on one timeline so you can watch what is actually changing.
- Log a weight or measurement in seconds
- Everything you log on one timeline
- Track body composition, labs and workouts
- Fat vs muscle trend (Premium)
Related Body Composition Calculators
Explore the rest of our body composition tools — each one adds a different piece of the picture.
Frequently Asked Questions
Tool Information
July 24, 2026
Dr. Jaydeep Sanghani
Meet Akabari

Dr. Jaydeep Sanghani
MBBS, MD, DNB(Anaesth.), PDCC(CCM), DrNB(CCM)
AIIMS Bhubaneswar · AIIMS Rishikesh
Critical care specialist and anesthesiologist with advanced training from AIIMS. Reviews health calculators at Calqulate to ensure medical accuracy and evidence-based standards.
About the authors

Meet Akabari
·Co-Founder, Calqulate.net